Biometry: Mean, Mode & Median, standard deviation, co-efficient of variation, skewness and kurtosis
Biometry:- It is the statistical analysis of biological observations and phenomena. It other words the application of statistical analysis to biological data.
Measures of Central Tendency:- The central tendency of a distribution is an estimate of the "center" of a distribution of values. There are three major types of estimates of central tendency:
1. Mean
2. Median
3. Mode
1. Mean:- It is probably the most commonly used method of describing central tendency. To calculate the mean add up all the values and divide by the number of values.
i. If the numbers x1, x2,…, xk occur only once, the arithmetic mean is:-
ii. If the numbers x1, x2,…, xk occur f1, f2,…,fk times respectively, the arithmetic mean is:-
.bmp)
2. Median:- It is the score found at the exact middle of the set of values. One way to compute the median is to list all scores in numerical order, and then locate the score in the center of the sample. If the two middle scores had different values, then average of two would determine the median.
For grouped data, the median is obtained using following:
.bmp)
where:
L = lower class limit of the median class (i.e., the class containing the median),
(Σf)1 = sum of frequencies of all classes lower than the median class,
fm = frequency of median class
c = class interval
3. Mode:- is the most frequently occurring value in the set of scores. To determine the mode, order the scores and then count each one. The most frequently occurring value is the mode.
In case of grouped data, the mode will be the value (or values) of x corresponding to the maximum point (or points) on the curve. From a frequency distribution or histogram, the mode can be obtained from the formula:
.bmp)
where L is the lower class limit of modal class (the class containing the mode), f1 is the frequency of the class previous to the modal class, f2 is frequency of the class just after the modal class and c is the size of modal class.
Standard Deviation (SD):- It is a more accurate and detailed estimate of dispersion because an outlier can greatly exaggerate the range. The Standard Deviation shows the relation that set of scores has to the mean of the sample. The standard deviation is the square root of the sum of the squared deviations from the mean divided by the number of scores.
.bmp)
If x1, x2,…,xk occur with frequencies f1, f2,…,fk respectively, the standard deviation can be computed as
.bmp)
In statistic, the Coefficient of variation formula (CV), also known as relative standard deviation (RSD), is a standardized measure of the dispersion of a probability distribution or frequency distribution. When the value of the coefficient of variation is lower, it means the data has less variability and high stability.
The formula for coefficient of variation is given below:
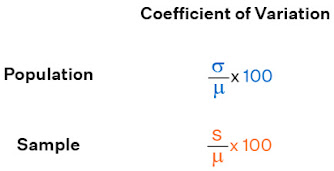
σ = Standard deviation of the population
S = Standard deviation of the sample
μ = Mean
Skewness and Kurtosis:-
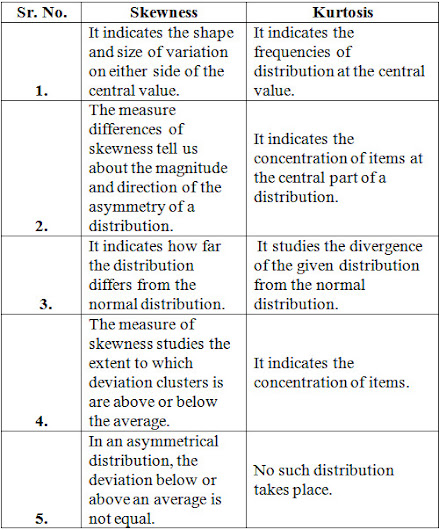
Skewness:- It is an important statistical technique that helps to determine asymmetrical behavior than of the frequency distribution, or more precisely, the lack of symmetry of tails both left and right of the frequency curve. A distribution or dataset is symmetric if it looks the same to the left and right of the center point.
Types of skewness:-
1. Symmetric Skewness:- A perfect symmetric distribution is one in which frequency distribution is the same on the sides of the center point of the frequency curve. In this, Mean = Median = Mode. There is no skewness in a perfectly symmetrical distribution.
2. Asymmetric Skewness:- A asymmetrical or skewed distribution is one in which the spread of the frequencies is different on both the sides of the center point or the frequency curve is more stretched towards one side or value of Mean. Median and Mode falls at different points.
i. Positive Skewness:- In this, the concentration of frequencies is more towards higher values of the variable i.e. the right tail is longer than the left tail.
ii. Negative Skewness:- In this, the concentration of frequencies is more towards the lower values of the variable i.e. the left tail is longer than the right tail.
Kurtosis:- It is also a characteristic of the frequency distribution. It gives an idea about the shape of a frequency distribution. Basically, the measure of kurtosis is the extent to which a frequency distribution is peaked in comparison with a normal curve. It is the degree of peakedness of a distribution.
Types of kurtosis:-
1. Leptokurtic:- Leptokurtic is a curve having a high peak than the normal distribution. In this curve, there is too much concentration of items near the central value.
2. Mesokurtic:- Mesokurtic is a curve having a normal peak than the normal curve. In this curve, there is equal distribution of items around the central value.
3. Platykurtic:- Platykurtic is a curve having a low peak than the normal curve is called platykurtic. In this curve, there is less concentration of items around the central value.
बायोमेट्री: माध्य, बहुलक और माध्यिका, मानक विचलन, भिन्नता गुणांक, विषमता और कुर्टोसिस
जीवमिति:- यह जैविक प्रेक्षणों और घटनाओं का सांख्यिकीय विश्लेषण है। दूसरे शब्दों में, यह जैविक आंकड़ों पर सांख्यिकीय विश्लेषण का अनुप्रयोग है।
केंद्रीय प्रवृत्ति के माप:- किसी वितरण की केंद्रीय प्रवृत्ति मूल्यों के वितरण के "केंद्र" का अनुमान है। केंद्रीय प्रवृत्ति के अनुमान के तीन प्रमुख प्रकार हैं:
1. औसत
2. माध्यिका
3. मोड
1. माध्य:- यह केंद्रीय प्रवृत्ति का वर्णन करने की सबसे अधिक प्रयुक्त विधि है। माध्य की गणना करने के लिए, सभी मानों को जोड़ें और मानों की संख्या से भाग दें।
i. यदि संख्याएँ x1, x2,…, xk केवल एक बार आती हैं, तो अंकगणितीय माध्य क्या होगा?
ii. यदि संख्याएँ x1, x2,…, xk क्रमशः f1, f2,…, fk बार आती हैं, तो अंकगणितीय माध्य क्या होगा?
2. माध्यिका:- यह मानों के समूह के ठीक मध्य में स्थित अंक होता है। माध्यिका ज्ञात करने का एक तरीका यह है कि सभी अंकों को संख्यात्मक क्रम में सूचीबद्ध किया जाए और फिर नमूने के केंद्र में स्थित अंक का पता लगाया जाए। यदि मध्य के दो अंकों के मान भिन्न-भिन्न हों, तो दोनों का औसत माध्यिका ज्ञात करेगा।
समूहीकृत डेटा के लिए, माध्यिका निम्न सूत्र का उपयोग करके प्राप्त की जाती है:
कहाँ:
L = माध्यिका वर्ग की निचली वर्ग सीमा (अर्थात, वह वर्ग जिसमें माध्यिका शामिल है),
(Σf)1 = माध्यिका वर्ग से नीचे के सभी वर्गों की आवृत्तियों का योग,
fm = माध्यिका वर्ग की आवृत्ति
c = वर्ग अंतराल
3. बहुलक (मोड़):- अंकों के समूह में सबसे अधिक बार आने वाला मान होता है। बहुलक ज्ञात करने के लिए, अंकों को क्रम में लगाएं और फिर प्रत्येक अंक को गिनें। सबसे अधिक बार आने वाला मान ही बहुलक होता है।
समूहीकृत डेटा के मामले में, बहुलक वक्र पर अधिकतम बिंदु (या बिंदुओं) के अनुरूप x का मान (या मान) होगा। आवृत्ति वितरण या हिस्टोग्राम से, बहुलक निम्न सूत्र से प्राप्त किया जा सकता है:
जहां L बहुलक वर्ग (बहुमूल्य गुणनखंड युक्त वर्ग) की निचली वर्ग सीमा है, f1 बहुलक वर्ग से पहले वाले वर्ग की आवृत्ति है, f2 बहुलक वर्ग के ठीक बाद वाले वर्ग की आवृत्ति है और c बहुलक वर्ग का आकार है।
मानक विचलन (SD):- यह फैलाव का अधिक सटीक और विस्तृत अनुमान है क्योंकि एक आउटलायर सीमा को बहुत अधिक बढ़ा सकता है। मानक विचलन यह दर्शाता है कि अंकों के समूह का नमूने के माध्य से क्या संबंध है। मानक विचलन माध्य से विचलन के वर्गों के योग के वर्गमूल को अंकों की संख्या से भाग देने पर प्राप्त होता है।
यदि x1, x2,…,xk क्रमशः f1, f2,…,fk आवृत्तियों के साथ घटित होते हैं, तो मानक विचलन की गणना इस प्रकार की जा सकती है:
सांख्यिकी में, विचरण गुणांक (CV), जिसे सापेक्ष मानक विचलन (RSD) भी कहा जाता है, किसी प्रायिकता वितरण या आवृत्ति वितरण के फैलाव का मानकीकृत माप है। विचरण गुणांक का मान जितना कम होता है, इसका अर्थ है कि डेटा में परिवर्तनशीलता कम है और स्थिरता अधिक है।
विचरण गुणांक का सूत्र नीचे दिया गया है:
σ = जनसंख्या का मानक विचलन
S = नमूने का मानक विचलन
μ = माध्य
विषमता और कुर्टोसिस:-
विषमता (Skewness):- यह एक महत्वपूर्ण सांख्यिकीय तकनीक है जो आवृत्ति वितरण के असममित व्यवहार को निर्धारित करने में सहायक होती है, या अधिक सटीक रूप से, आवृत्ति वक्र के बाएँ और दाएँ दोनों सिरों की समरूपता की कमी को दर्शाती है। कोई वितरण या डेटासेट सममित होता है यदि वह केंद्र बिंदु के बाएँ और दाएँ दोनों ओर समान दिखाई देता है।
विषमता के प्रकार:-
1. सममित विषमता:- एक पूर्ण सममित वितरण वह होता है जिसमें आवृत्ति वक्र के केंद्र बिंदु के दोनों ओर आवृत्ति वितरण समान होता है। इसमें माध्य = माध्यिका = बहुलक होता है। पूर्ण सममित वितरण में कोई विषमता नहीं होती।
2. असममित विषमता:- एक असममित या विषम वितरण वह होता है जिसमें आवृत्तियों का फैलाव केंद्र बिंदु के दोनों ओर अलग-अलग होता है या आवृत्ति वक्र एक तरफ अधिक फैला हुआ होता है या माध्य, माध्यिका और बहुलक का मान अलग-अलग बिंदुओं पर होता है।
i. धनात्मक विषमता:- इसमें आवृत्तियों का संकेंद्रण चर के उच्च मानों की ओर अधिक होता है, अर्थात् दायाँ सिरा बाएँ सिरे से लंबा होता है।
ii. ऋणात्मक विषमता:- इसमें, आवृत्तियों का संकेंद्रण चर के निम्न मानों की ओर अधिक होता है, अर्थात् बायां सिरा दाएं सिरे से लंबा होता है।
कुर्टोसिस:- यह भी आवृत्ति वितरण की एक विशेषता है। यह आवृत्ति वितरण के आकार के बारे में जानकारी देता है। मूलतः, कुर्टोसिस का माप यह दर्शाता है कि सामान्य वक्र की तुलना में आवृत्ति वितरण कितना अधिक शिखरित है। यह वितरण के शिखरित होने की मात्रा है।
कुर्टोसिस के प्रकार:-
1. लेप्टोकुर्टिक:- लेप्टोकुर्टिक एक ऐसा वक्र है जिसका शिखर सामान्य वितरण की तुलना में अधिक ऊँचा होता है। इस वक्र में, केंद्रीय मान के निकट वस्तुओं का अत्यधिक संकेंद्रण होता है।
2. मेसोकर्टिक:- मेसोकर्टिक एक ऐसा वक्र है जिसका शिखर सामान्य वक्र की तुलना में अधिक चौड़ा होता है। इस वक्र में, केंद्रीय मान के चारों ओर वस्तुओं का समान वितरण होता है।
3. प्लैटिकर्टिक:- प्लैटिकर्टिक वक्र वह वक्र कहलाता है जिसका शिखर सामान्य वक्र की तुलना में नीचा होता है। इस वक्र में केंद्रीय मान के आसपास वस्तुओं का संकेंद्रण कम होता है।
Comments
Post a Comment